

Hypothesis testing is a powerful statistical tool that enables researchers and analysts to draw meaningful conclusions from data. Whether you’re a scientist conducting experiments, a business professional analyzing market trends, or a student working on a research project, understanding hypothesis testing is crucial for making informed decisions based on evidence.
In this practical guide, we will demystify the process of hypothesis testing and provide you with a step-by-step framework to confidently apply this technique in your own work.
Understanding Hypotheses
- Null Hypothesis (H0): The null hypothesis is the default assumption in hypothesis testing. It states that there is no significant difference, effect, or relationship between variables or conditions being studied. The null hypothesis is typically denoted as H0.
- Alternative Hypothesis (Ha): The alternative hypothesis is the counterpart to the null hypothesis. It proposes a specific difference, effect, or relationship between variables or conditions being studied. The alternative hypothesis can be directional, indicating a specific direction of the effect, or non-directional, suggesting that there is simply a difference without specifying the direction. The alternative hypothesis is denoted as Ha.
- H0: “There is no significant difference in pain relief between the new drug and the standard drug.”
- Ha: “The new drug provides greater pain relief compared to the standard drug.”
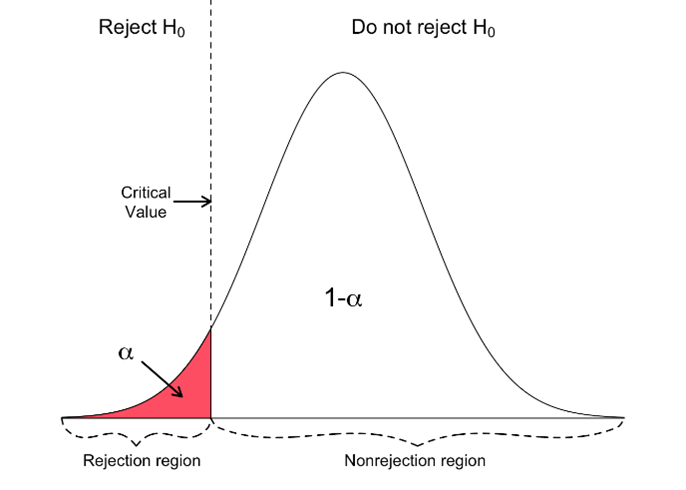
- Significance Level (α): A predetermined threshold to determine criteria for accepting or rejecting the null hypothesis. It represents the maximum acceptable probability of making a Type I error (wrongly rejecting the null hypothesis). Commonly used levels are 0.05 (5%) and 0.01 (1%).
- Critical Region: The range of values of the test statistic that would lead to rejecting the null hypothesis. If the calculated test statistic falls within the critical region, the null hypothesis is rejected.
- One-Tailed Test: In a one-tailed test, you would predict a specific direction of the effect. Let’s say you predict that the new exercise program will result in greater weight loss.
Your null hypothesis (H0) would be that there is no significant difference in weight loss between the two programs. The alternative hypothesis (Ha) would be that the new program leads to more weight loss.
By conducting a one-tailed test, you focus on whether the weight loss with the new program is significantly greater, without considering the possibility of it being less. The critical region would be located in one tail of the bell-shaped curve, and the p-value would be calculated accordingly.
If the p-value is smaller than the chosen significance level, you would reject the null hypothesis in favor of the alternative hypothesis, indicating that the new exercise program leads to statistically significant weight loss.

- Two-Tailed Test: In a two-tailed test, you would not have a specific directional prediction. Let’s say you’re simply interested in whether there is any significant difference in weight loss between the two programs.
Your null hypothesis (H0) would be that there is no significant difference, and the alternative hypothesis (Ha) would be that there is a difference (without specifying the direction).
By conducting a two-tailed test, you consider the possibility of weight loss being greater or less with the new program. The critical region would be split between both tails of the bell-shaped curve, and the p-value would be calculated for both sides. If the p-value for either direction is smaller than the chosen significance level, you would reject the null hypothesis in favor of the alternative hypothesis, indicating that there is a statistically significant difference in weight loss between the programs.
In summary, a one-tailed test is used when there is a specific directional prediction, focusing on that particular effect or relationship. A two-tailed test is used when there is no specific prediction or when both directions of the effect are of interest. The critical region and p-value are determined based on the type of test, with the critical region located in the relevant tail(s) of the bell-shaped curve. Understanding these concepts helps in selecting the appropriate test and interpreting the results accurately in hypothesis testing.
Types of Tests
In hypothesis testing, different types of tests are used depending on the research question and the type of data being analyzed. Each type of test is designed to address specific research scenarios and make appropriate statistical comparisons.
Here are some common types of hypothesis tests:
- T-tests: T-tests are used to compare means between two groups. They are appropriate when the data follow a roughly normal distribution and the variances of the two groups are assumed to be equal or can be approximated as equal.
- Chi-square tests: Chi-square tests are used to examine the association between categorical variables. They assess whether the observed frequencies differ significantly from the expected frequencies under the assumption of independence.
- Analysis of Variance (ANOVA): ANOVA is used to compare means between two or more groups. It determines whether there are significant differences in means across multiple categories or levels of an independent variable.
- Regression Analysis: Regression analysis is used to examine the relationship between a dependent variable and one or more independent variables. It assesses whether there is a statistically significant linear relationship between the variables.
- Non-parametric Tests: Non-parametric tests, such as the Mann-Whitney U test or the Wilcoxon signed-rank test, are used when the data do not meet the assumptions of parametric tests (e.g., normality, equal variances).
The choice of the appropriate test depends on the research question, the nature of the data, and the assumptions underlying each test. It is essential to consider the characteristics of the data and select a test that is most appropriate for the research scenario.
Significance Level and Critical Region
- Significance Level (α): A predetermined threshold to determine criteria for accepting or rejecting the null hypothesis. It represents the maximum acceptable probability of making a Type I error (wrongly rejecting the null hypothesis). Commonly used levels are 0.05 (5%) and 0.01 (1%).
- Critical Region: The range of values of the test statistic that would lead to rejecting the null hypothesis. If the calculated test statistic falls within the critical region, the null hypothesis is rejected.
Type I and Type II Errors:
- Type I error: Occurs when the null hypothesis is wrongly rejected.
- Type II error: Occurs when the null hypothesis is not rejected, even though there is a significant effect or difference.
The probability of a Type II error is denoted as β (beta) and is influenced by factors such as sample size, effect size, and the chosen significance level. Lowering the significance level increases the probability of a Type II error.
How to interpret the results of hypothesis testing
- Interpreting results involves comparing the obtained p-value with the chosen significance level.
- If the p-value is smaller than the significance level, it suggests that the data provide evidence to reject the null hypothesis.
- If the p-value is greater than the significance level, it indicates that there is insufficient evidence to reject the null hypothesis.
Steps for hypothesis testing
- Formulate the Hypotheses: Define the research question and create null and alternative hypotheses.
- Choose the Significance Level: Determine the threshold for rejecting the null hypothesis.
- Select the Test Statistic: Choose a statistical method to assess the evidence against the null hypothesis.
- Collect and Analyze the Data: Gather data, calculate the test statistic using the chosen method.
- Determine the Critical Region and P-value: Identify the range of values leading to null hypothesis rejection or calculate the p-value.
- Make a Decision and Draw Conclusions: Decide whether to reject the null hypothesis based on the critical region or p-value.
- Interpret and Report Results: Explain the findings, including the decision made, supporting evidence, and any limitations or assumptions.
These steps provide a framework for conducting hypothesis testing and drawing meaningful conclusions from data.
It is important to note that hypothesis testing is not without challenges. Researchers should be mindful of potential pitfalls, such as misinterpreting p-values, inappropriate significance levels, and assumptions that need to be met. By being aware of these considerations, researchers can conduct hypothesis testing with greater accuracy and reliability.
Hypothesis testing is a powerful tool for drawing meaningful conclusions from data. This guide has provided an overview of the key concepts involved, including formulating hypotheses, different types of tests, significance level and critical region, interpreting results, and the steps involved in hypothesis testing.
While we have covered important aspects of it, there are additional topics, such as assumptions, that require further exploration. Assumptions include factors like independence, normality, and equal variances, which impact the validity of results. Exploring specialized resources and academic literature will provide a deeper understanding of these assumptions and their implications.
In our future articles, delving into the assumptions and their effects will enhance your understanding of hypothesis testing. By considering these assumptions and their validity, you can conduct hypothesis testing with greater accuracy and make informed decisions based on reliable evidence.