dsaihub.com

Leveraging Azure for Machine Learning Model Implementation

Beginner’s Guide to Building and Deploying ML Models on Azure

Machine Learning (ML) is revolutionizing industries by enabling data-driven decision-making and predictive capabilities. However, setting up and implementing ML models can often feel daunting, especially for beginners. Microsoft Azure, a leading cloud computing platform, simplifies this process with its comprehensive tools and services. Whether you’re a data scientist, developer, or someone new to ML, Azure offers the resources you need to build, deploy, and manage machine learning models efficiently.

In this detailed guide, we will explain how to leverage Azure for ML model implementation, breaking it down into clear, actionable steps.

What is Azure?

Before we dive into ML, let’s understand what Azure is.
Microsoft Azure is a cloud computing platform that provides a variety of services, such as:

  • Storage: Store and manage data securely.
  • Compute: Run applications and processes.
  • Networking: Connect different systems and services.
  • AI and Machine Learning: Build and deploy intelligent applications.

Azure has tools and services specifically designed for machine learning, which can help you at every stage of your ML project—from data preparation to training, testing, and deployment.

Why Use Azure for Machine Learning?

Azure stands out for its seamless integration, scalability, and user-friendly tools. Here are some key benefits:

  1. End-to-End Workflow Support: From data preparation to deployment, Azure provides all the tools required for the entire ML lifecycle.
  2. Ease of Use: Features like Azure Machine Learning Studio offer intuitive, drag-and-drop interfaces for beginners.
  3. Scalability: Azure’s infrastructure scales according to your needs, handling projects of any size.
  4. Integration: Works well with other Azure services like Databricks, Synapse Analytics, and Power BI for a cohesive experience.

Setting Up Your Environment

1. Create an Azure Account
  • Visit the Azure website and create an account.
  • New users often get free credits and access to various services for an initial period.
2. Set Up an Azure Machine Learning Workspace
A workspace is your central hub for all ML activities in Azure.
  • Go to the Azure portal.
  • Search for “Machine Learning” and create a new workspace.
  • Configure details like resource group, region, and pricing tier.

Steps of Implementing an ML Model Using Azure

Step 1: Data Collection and Preparation

The first and most crucial step in an ML project is gathering and preparing the data the model will use to learn.

  • Models are only as good as the data they are trained on.
  • The quality, volume, and relevance of data determine the accuracy and reliability of the model.
Azure Tools for Data Collection and Preparation:
  1. Azure Blob Storage:

    • A scalable and cost-effective solution for storing unstructured data like images, text files, and videos.
    • Allows easy retrieval of data during training or inference.
  2. Azure Data Lake Storage:

    • Specifically designed for big data workloads.
    • Supports high-throughput processing, making it ideal for training on large datasets.
  3. Azure Data Factory:

    • An orchestration and ETL (Extract, Transform, Load) tool to gather data from multiple sources.
    • Automates data movement and transformation, ensuring your data is clean and ready for analysis.
      Example Use Case: Imagine you’re building a model to predict customer churn. Using Azure Data Factory, you can pull customer data from databases, clean it to remove duplicates, and store it in Azure Blob Storage for further analysis.

Step 2: Data Exploration and Analysis

Once data is collected, the next step is to explore and analyze it to understand patterns and relationships and handle issues like missing values.

  • Helps uncover trends and anomalies.
  • Identifies features (variables) that are important for model building.
Azure Tools for Data Exploration and Analysis:
  1. Azure Databricks:

    • Built on Apache Spark, Databricks enables large-scale data analysis.
    • Supports languages like Python and R for statistical analysis and visualization.
    • Provides notebooks for coding and collaborating in real time.
  2. Azure Synapse Analytics:

    • An integrated platform for querying data using SQL.
    • Combines the power of big data and data warehousing, making it easy to analyze structured and semi-structured data.
      Example Use Case: Using Azure Databricks, you clean your dataset by removing rows with missing values and create visualizations to identify correlations between customer behavior and churn.

Step 3: Model Selection

Once the data is ready, the next step is to choose a machine learning model suitable for your problem.

  • The type of model (e.g., linear regression, random forest, or neural network) impacts performance.
  • Different problems (classification, regression, clustering) require different algorithms.
Azure Tools for Model Selection:
  1. Azure Machine Learning Studio:

    • A no-code tool that allows you to build and compare models using drag-and-drop functionality.
    • Offers pre-built algorithms for classification, regression, and clustering tasks.
  2. Azure AutoML:

    • Automatically evaluates multiple models and algorithms.
    • Provides the best model based on performance metrics like accuracy and precision.
      Example Use Case: You’re unsure which algorithm to use for your churn prediction problem. With Azure AutoML, you upload your dataset, and it tests models like decision trees, logistic regression, and gradient boosting, selecting the best one for your data.

Step 4: Model Training

Training involves teaching the model to recognize patterns in the data by providing labeled examples (training data).

  • This step helps the model learn relationships between inputs and outputs.
  • Well-trained models generalize better to unseen data.
Azure Tools for Model Training:
  1. Azure Machine Learning:

    • Provides managed compute resources like GPUs and CPUs to train models quickly.
    • Supports popular ML frameworks like TensorFlow, PyTorch, and Scikit-learn.
  2. Compute Instances:

    • Azure offers N-Series VMs optimized for deep learning tasks.
    • Allows you to choose cost-effective resources based on your model’s requirements.
      Example Use Case: You use Azure Machine Learning with GPU instances to train a deep learning model on customer transaction data, achieving faster results.

Step 5: Model Evaluation

After training, you need to test the model’s performance on unseen data to ensure it makes accurate predictions.

  • Evaluation helps detect overfitting (where the model performs well on training data but poorly on new data).
  • Metrics like accuracy, precision, recall, and F1-score help compare models.
Azure Tools for Model Evaluation:
  1. Azure ML Studio:

    • Visualizes evaluation metrics and provides insights into model performance.
    • Allows side-by-side comparison of different models.
  2. Cross-Validation:

    • Azure supports splitting your data into multiple subsets to validate model performance, ensuring it generalizes well.
      Example Use Case: You test your churn prediction model on a validation set using Azure ML Studio, observing an F1-score of 0.85, indicating good balance between precision and recall.

Step 6: Model Deployment

Deployment involves making your trained model available for real-world applications, where it can make predictions on new data.

  • Allows integration into applications like customer dashboards or recommendation systems.
  • Enables real-time or batch predictions.
Azure Tools for Model Deployment:
  1. Azure Machine Learning Service:

    • Deploys models as web services (APIs) that can be called from applications.
    • Scales automatically based on traffic.
  2. Azure Kubernetes Service (AKS):

    • Deploys containerized models, providing scalability and robust orchestration.
    • Suitable for high-demand scenarios.
  3. Azure Functions:

    • Ideal for lightweight serverless deployments.
    • Triggered by events like file uploads or API requests.
      Example Use Case: You deploy your churn prediction model using Azure ML Service, enabling your customer support team to access predictions via a simple web interface.

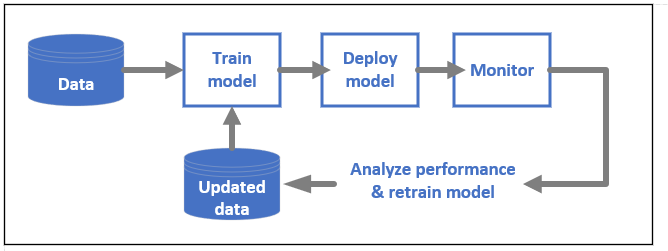
Step 7: Monitor and Retrain the Model

Models need to be monitored for performance over time to ensure accuracy as data patterns evolve. Retraining keeps the model updated.

  • Data changes over time (data drift), making periodic updates essential.
  • Continuous monitoring ensures reliability in production.
Azure Tools for Monitoring and Retraining:
  1. Azure Monitor:

    • Tracks metrics like response time, prediction accuracy, and server load.
    • Sends alerts if performance drops below a threshold.
  2. Azure ML Pipelines:

    • Automates the retraining process when new data is available.
    • Ensures minimal manual intervention and faster updates.
      Example Use Case: Your deployed model detects a drop in accuracy. Using Azure ML Pipelines, you automate the retraining process with updated customer data.

Azure Tools and Services for Machine Learning

Service Purpose
Azure Machine Learning Central platform for building, training, and deploying ML models.
Azure Databricks Data preparation and big data analytics.
Azure Synapse Analytics Large-scale data warehousing and analytics.
Azure Cognitive Services Pre-built AI APIs for tasks like vision, speech, and language processing.
Azure Kubernetes Service Scalable deployment of containerized ML models.
Azure Blob Storage Cost-effective storage for datasets and model artifacts.
Example Use Case: Predicting Customer Churn

Let’s say you want to predict which customers are likely to stop using your service:

  1. Data Storage: Store customer behavior data in Azure Blob Storage.
  2. Data Cleaning: Use Azure Databricks to preprocess and clean the dataset.
  3. Model Training: Train a classification model using Azure Machine Learning Studio.
  4. Deployment: Deploy the model as an API using Azure Kubernetes Service.
  5. Integration: Connect the API to your CRM system for real-time predictions.

Conclusion

Azure simplifies the machine learning journey by providing a unified platform that supports every stage of model implementation. Whether you’re a complete beginner or an experienced data scientist, Azure’s tools are designed to help you succeed. By leveraging its scalable infrastructure and easy-to-use interfaces, you can focus on solving real-world problems with the power of machine learning.

With Azure, implementing machine learning models is no longer a challenge—it’s an opportunity to innovate and drive impactful outcomes.

Share

Exploring SageMaker Studio

INTRODUCTION TO FEATURES AND CAPABILITIES OF SAGEMAKER STUDIO


Introduction

Machine Learning (ML) has undeniably transformed various sectors, from healthcare and finance to entertainment and e-commerce. 

Traditionally, developing an ML model involved multiple stages – data collection, preprocessing, feature engineering, model training, evaluation, and deployment.

This process often required switching between various platforms and tools, causing integration challenges and efficiency bottlenecks. 

Amazon, realizing these intricacies, launched SageMaker Studio to provide a consolidated platform addressing the entire ML lifecycle. Through this article, let’s delve deeper into the capabilities of SageMaker Studio and understand its significance in modern ML development.

Amazon SageMaker vs. SageMaker Studio: What’s the Difference?

Imagine you’re cooking. Amazon SageMaker is like having all the ingredients and tools laid out for you. You can make anything you want, but you need to know how to use each tool and follow recipes on your own.

On the other hand, SageMaker Studio is like a step-by-step cooking app. It not only provides you with the ingredients and tools but also guides you through the cooking process with helpful visuals and tips.

Amazon SageMaker

  • What it is: A tool that gives you everything you need to do machine learning. But, you’ll mostly be working through code and commands.
  • Best for: People who are comfortable with coding and using AWS tools.

SageMaker Studio

  • What it is: A more user-friendly version of SageMaker. It has a visual interface, which means you can see and interact with your data, models, and more through charts and drag-and-drop features.
  • Best for: Those who want an easier, more visual way to do machine learning, especially if they’re new to AWS or machine learning.

In Short: SageMaker gives you the tools, while SageMaker Studio makes those tools easier and more visual to use.

1. SageMaker Studio – A Comprehensive Look

Amazon SageMaker Studio often serves as the “IDE for ML”.

IDE, or Integrated Development Environment, is a platform that offers a suite of tools needed for software (or in this case, model) development. SageMaker Studio takes this concept and specifically tailors it for the unique demands of ML projects.

Characteristics that Define its IDE Nature

  • Unified Environment: Rather than juggling multiple tools for various ML tasks, developers can handle everything, right from data sourcing to model deployment, within SageMaker Studio. This cohesiveness not only boosts productivity but also reduces chances of errors due to software incompatibilities.
  • Data Accessibility: The seamless integration with AWS services means that data stored in S3 buckets, AWS databases, or other AWS platforms can be effortlessly accessed. No more tedious data transfers or conversions.
  • Exploratory Data Analysis (EDA): Before diving into model building, understanding the data is paramount. SageMaker Studio provides numerous tools for data visualization and exploration, making EDA easier.
  • Flexible Model Building: The platform isn’t restrictive. Whether you prefer TensorFlow, PyTorch, MXNet, or other popular frameworks, SageMaker Studio supports it. This flexibility ensures developers can use the tools they’re most comfortable with or the ones most suited for the task at hand.
  • Distributed Training Capabilities: Training a complex model on vast datasets can be time-consuming. SageMaker Studio’s distributed training feature divides this workload across multiple instances. This parallel processing considerably cuts down the training time. For those who may not be familiar, picture a scenario where ten chefs collaborate to create a grand banquet instead of relying on just one chef. This collaboration significantly accelerates the completion of the task!
  • Technical Insight: ‘Distributed training’ is essentially breaking down the dataset into smaller chunks and then processing these chunks on different machines simultaneously. These individual machines then share their insights, culminating in a collectively trained model. This collaborative approach significantly speeds up training, especially for deep learning models.

2. Notebook Instances 

What is a Notebook Instance?

A Notebook Instance is a virtual environment in the cloud where you can run and interact with Jupyter notebooks. Think of it as a personal computer online, tailored for coding and data tasks. Within platforms like SageMaker Studio, these Notebook Instances allow users to write code, visualize data, and document their work all in one place.

Instance Components

  • CPU: The “brain” of your instance. More vCPUs mean faster processing but at a higher cost.
  • Memory (RAM): Temporary data storage. More RAM lets you manage larger datasets efficiently, similar to having a larger workspace.
  • GPU: Initially for rendering, GPUs excel in parallel processing, speeding up deep learning tasks. It’s like multiple assistants working simultaneously.

When picking a cloud computer, think about your task and how much you want to spend. Simple tasks can use basic computers. Bigger tasks, especially with a lot of data, need stronger computers with more features. But keep in mind, the stronger the computer, the more it will cost.

3. SageMaker Debugger – Performance Monitor

Even after you’ve chosen an instance, monitoring its performance ensures you’re using resources efficiently. The SageMaker Debugger tool acts as a vigilant supervisor. It watches over your model training process, ensuring you’re not using too much or too little of your instance’s resources, helping in cost optimization and efficient performance.

Now that we’ve established the importance of Notebook Instances, let’s transition to how SageMaker enables model predictions.

4. Endpoints vs. Batch Transforms

Machine learning models are trained with a primary goal: to make predictions or infer insights from new, unseen data. Amazon SageMaker provides two primary mechanisms for this – Endpoints and Batch Transforms. Both serve the purpose of making predictions, but they cater to different scenarios and use cases.

Feature

Endpoints

Batch Transforms

Purpose

Real-time predictions

Bulk predictions on a dataset

Cost Model

Pay for the duration the endpoint is running

Pay for the compute time of the transformation

Duration

Continuously running until stopped

Runs once for the provided dataset and then stops

Input

Single or small batches of data points

Large datasets stored in S3

Output

Instant predictions for each request

Results saved to an S3 location

Usage Scenarios

Web/mobile apps, real-time analytics

Periodic analytics, offline processing

Infrastructure

Always-on infrastructure

Infrastructure spun up and down as needed

Latency

Low (designed for real-time)

Higher (due to the batch nature)

Making the Choice

Your choice between Endpoints and Batch Transforms depends on the nature of your application and its requirements. Real-time, continuous prediction needs are best served by Endpoints. In contrast, bulk, non-immediate predictions are more cost-effective and efficient with Batch Transforms. By understanding the nuances of both, you can optimize costs, performance, and response times for your machine learning applications.

5. Conclusion

SageMaker Studio, with its array of features, has positioned itself as a pivotal tool in the ML development landscape. By offering an integrated environment, flexible model building capabilities, and efficient training methods, it streamlines the ML workflow. Whether you’re a seasoned data scientist or an ML enthusiast, understanding SageMaker Studio’s offerings can significantly enhance your machine learning journey.

This subject is quite vast. To understand it more deeply and acquire comprehensive knowledge related to AWS, please click here to visit the official AWS website or explore other AWS resources.

Share

Introduction to AWS and Amazon SageMaker

Introduction to AWS and Amazon SageMaker

cloud, computer, hosting-3406627.jpg

Amazon Web Services (AWS) has revolutionized the way businesses think about IT infrastructure. Gone are the days when companies had to invest heavily in physical hardware and data centers.
Today, with AWS, businesses can access a plethora of services on the cloud, paying only for what they use.
One such remarkable service is Amazon SageMaker, a fully managed service that allows developers and data scientists to build, train, and deploy machine learning models at scale.
In this article, we’ll delve into the world of AWS and explore the capabilities of SageMaker.

What is AWS?

Amazon Web Services, or AWS, is Amazon’s cloud computing platform, offering a wide range of services from data storage to machine learning. AWS provides businesses with a flexible, scalable, and cost-effective solution to manage their IT needs. With data centers in multiple geographic regions, AWS ensures high availability and fault tolerance.

Some of the popular services offered by AWS include:

Amazon S3

  • S3 allows storing and retrieving vast data amounts online.
  • It hosts websites, stores backups, and serves application content.
  • It’s durable, scalable, and secure with pay-as-you-use pricing.
  • Different storage classes, like S3 Standard and Glacier, cater to varied data access needs.
  • Features include versioning, encryption, and cross-region replication.

Amazon EC2

  • EC2 provides virtual cloud servers for diverse applications.
  • It offers customizable instances based on needs and budget.
  • Users can tailor instances with specific OS, software, and security settings.
  • EC2 has load balancing, auto-scaling, and spot instances for optimized performance.Additional services include EBS, EFS, and ELB for storage and networking.

IAM (Identity and Access Management)

  • IAM manages user permissions for AWS resources.
  • It defines access levels within your AWS account.
  • Security features include MFA, password policies, and access keys.
  • IAM integrates with AWS Organizations, SSO, and Secrets Manager for streamlined identity management.

Diving into Amazon SageMaker

Amazon SageMaker stands out as a game-changer for those in the machine learning and data science fields. Here’s why:

User-Friendly Interface: Bridging the Gap for All Users

Amazon SageMaker stands out in the crowded field of machine learning platforms, primarily because of its user-centric design. Recognizing the diverse range of its user base, from novices taking their first steps in machine learning to seasoned experts with years of experience, SageMaker offers an interface that caters to all.
Its design principles prioritize simplicity and clarity. As a result, newcomers find it less intimidating to start their machine learning journey, while professionals appreciate the streamlined processes that enhance their productivity.
The platform eliminates the need for extensive prior knowledge, ensuring that users can focus on building and refining their models rather than navigating a complex interface.

Power of Jupyter Notebooks: A Familiar Environment with Enhanced Capabilities

Jupyter Notebooks have become synonymous with data exploration and analysis. Their interactive nature allows data scientists to combine code execution, rich text, and visualizations in a single document.
SageMaker elevates this experience by seamlessly integrating with Jupyter. Users can effortlessly transition their existing workflows into SageMaker, benefiting from the platform’s scalability and additional tools.
This integration means that data scientists can continue to work in a familiar environment while leveraging the advanced capabilities of SageMaker.

End-to-End Machine Learning Pipeline: Simplifying the Complex

Machine learning projects often involve multiple stages, from initial data cleaning and preprocessing to the final deployment of the trained model. SageMaker streamlines this process by offering a comprehensive suite of tools that cover every phase of a machine learning project.
Whether you’re preprocessing vast datasets, tuning hyperparameters, or deploying models to a production environment, SageMaker ensures continuity. This holistic approach eliminates the need to switch between disparate tools or platforms, providing users with a consistent and unified experience.

Enhanced Security with IAM: Fortifying Your Machine Learning Assets

In today’s digital age, security is paramount. SageMaker’s integration with AWS’s Identity and Access Management (IAM) goes beyond basic access control.
It offers granular permissions, allowing administrators to specify who can access specific resources and what actions they can perform. Whether it’s restricting access to a particular dataset or defining roles for different team members, IAM provides the flexibility to tailor security protocols to specific needs.
This robust security framework ensures that machine learning assets, from datasets to trained models, are safeguarded against unauthorized access and potential threats.

Optimized Performance with Elastic Inference: Maximizing Efficiency for Deep Learning

Deep learning models, with their intricate architectures, can be computationally intensive. Training and inference with these models demand significant resources, which can lead to increased costs and longer processing times. SageMaker addresses this challenge with its Elastic Inference feature.
By dynamically allocating just the right amount of computational power needed for inference, SageMaker ensures that deep learning models operate efficiently. This optimization means faster results without the overhead of provisioning excessive resources, striking the perfect balance between performance and cost.

Conclusion

AWS, with its vast array of services, has truly democratized the cloud computing landscape. For businesses and individuals keen on harnessing the power of machine learning, Amazon SageMaker offers a simplified and efficient platform. Whether you’re a seasoned data scientist or a newbie, SageMaker’s intuitive design and powerful features make it a must-try in the realm of cloud-based machine learning.

Share

SQL Subqueries

Getting Started with SQL Subqueries: Beginner's Guide

Structured Query Language (SQL) is like a magic wand for managing and playing with data in databases. It can do more than just simple searches and joins. In this article, we will break down the complexities of SQL subqueries, making them more accessible and demonstrating how they can empower you to uncover valuable insights within your data. Whether you’re new to SQL or an experienced practitioner, join us as we explore the fascinating world of subqueries and discover how they can elevate your data analysis skills.”

Subqueries: Your Data Detective

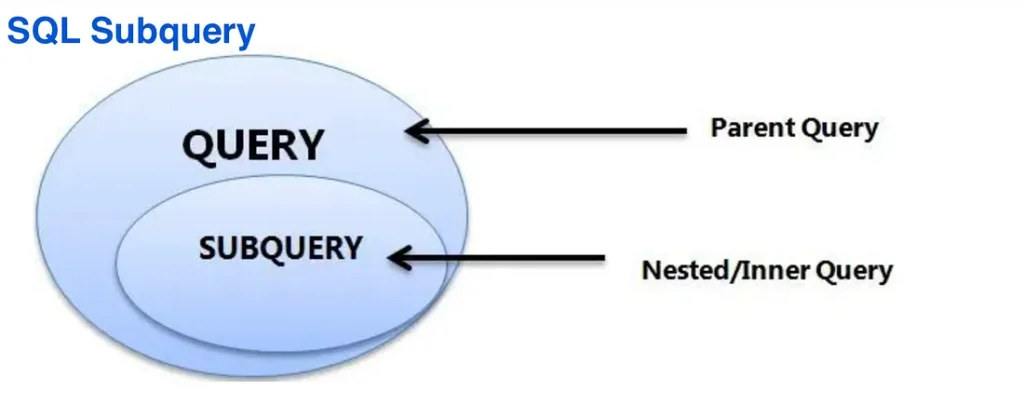
A subquery is like a secret agent query inside another query. It’s a special tool that lets you use the results of one query in another. You can use subqueries in different parts of your SQL command, like when you want to:

Filter Rows: Imagine you have a list of customers and their orders. Subqueries can help you find customers who’ve placed orders. It’s like saying, “Show me all the customers who are also in the orders list.

SELECT customer_name FROM customers WHERE customer_id IN (SELECT customer_id FROM orders); 

In this example, the subquery finds all the customer IDs from the “orders” table, and the main query picks out customers who match those IDs in the “customers” table. This helps you find customers who’ve ordered something.

Math and Aggregates: Subqueries can also help you do math with data. Let’s say you want to find employees whose salary is higher than the average in their department. It’s like finding the top earners in each team.

SELECT employee_name, salary FROM employees WHERE salary > (SELECT AVG(salary) FROM employees WHERE department_id = employees.department_id);

In this case, the subquery calculates the average salary for each department, and the main query finds employees whose salary beats that average. This helps you spot high earners in each team.

Linked Subqueries: Some subqueries even talk to the main query. They look at what the main query is doing and adjust their results. For example:

SELECT product_name FROM products p WHERE price > (SELECT AVG(price) FROM products WHERE category_id = p.category_id); 

Here, the subquery calculates the average price for each product category, and the main query picks products with prices higher than the average for their category. It’s like finding the expensive items in each group.

Derived Tables: Your Temporary Data Playground

A derived table is like a pop-up table that appears just when you need it. It’s temporary and created within your SQL command. This table is useful when you want to do some fancy stuff with your data, like making it dance or mix it up.

Here’s a simple example:

SELECT d.department_name, e.total_salary FROM (
  SELECT department_id, SUM(salary) AS total_salary FROM employees GROUP BY department_id
) AS e JOIN departments d ON e.department_id = d.department_id;

In this query, the derived table (we call it “e”) calculates the total salary for each department. Then, the main query joins this “e” table with the “departments” table to get department names and total salaries. It’s like making a report card for each department.

Why Use These Tricks?

  1. Simplify Complex Problems: Subqueries and derived tables help you break big problems into smaller, easier ones in sql
  2. Reuse Your Code: You can save your tricks and use them again and again. It’s like having your favorite magic spells ready.
  3. Speed Things Up: These tricks can make your searches faster by sorting and filtering data before it gets complicated.
  4. Get Creative: You can do all sorts of cool stuff, like math, filtering, and transforming data, right inside your SQL command.
  5. Make Reporting Easy: When you’re making reports or doing fancy analysis, these tricks help you get the data you need without pulling your hair out.

But beware! Too many tricks can slow things down. Here are some tips:

  1. Optimize: Make sure your tricks are well-oiled. Use the right tools, don’t pull too much data, and structure your code smartly.
  2. Don’t Overdo It: Use these tricks wisely. Too many tricks can make your code messy and hard to understand.
  3. Index Your Data: Make sure the columns you’re using in your tricks are properly organized. This speeds up your magic
  4. Test and Fix: Always check how your tricks perform with different data. Fix any problems you find.

In summary, subqueries and derived tables are like hidden gems in SQL. They help you solve complex problems, make your code reusable, and speed up your searches. Just remember to use them wisely and keep your magic wand (your SQL skills) well-practiced. You’ll become a data wizard in no time!

Share

SQL Joins Unveiled: Bridging Data Worlds in Relational Databases

When navigating the vast seas of data in relational databases, SQL joins act as the bridges connecting disparate islands of information. These operations, while technical, are the keystones of data analysis, stitching together otherwise isolated data points into a coherent tapestry of insights. In this comprehensive guide, we will embark on a journey through the multifaceted realm of SQL joins.

1. Inner SQL Joins: The Essential Link

The inner join, often termed the natural join, serves as the primary connector in the world of SQL joins:

    • Basics: At its essence, the inner join merges tables on common grounds, selecting only the records that have matching values in both tables.

    • Real-World Scenario: Suppose a retail company wishes to find out which of its registered customers have made purchases. By employing an inner join between a “customers” table and an “orders” table on the “customer_id” column, they can swiftly gather this data.

SELECT orders.order_id, customers.customer_name 
FROM orders 
INNER JOIN customers 
ON orders.customer_id = customers.customer_id;

    • Takeaway: The inner join is a selective merge, ensuring clarity by eliminating non-matching data.

2. Left Outer SQL Joins: Leaving No Data Behind on the Left

In scenarios where data inclusivity from the primary table is paramount, the left join comes to the rescue:

    • Basics: This join type retrieves all records from the left table, and any corresponding records from the right table.

    • Real-World Scenario: Consider a hospital analyzing patient visits. They’d want to see all registered patients and their visits. However, not all patients might have visit records. A left join between “patients” and “visits” tables would provide a complete list of patients, alongside any visit details.

SELECT patients.patient_name, visits.visit_date 
FROM patients 
LEFT JOIN visits 
ON patients.patient_id = visits.patient_id;

3. Right Outer SQL Joins: Championing the Right

The right join, while less commonly used, is equally potent:

    • Basics: It’s the reverse of a left join, ensuring all data from the right table is fetched.

    • Real-World Scenario: A publishing house, analyzing all books and their respective authors, would use a right join if they list books first, even those without designated authors.

SELECT books.book_title, authors.author_name 
FROM books 
RIGHT JOIN authors 
ON books.author_id = authors.author_id;

4. Full SQL Joins: The All-Inclusive Bridge

When data from both participating tables is of equal importance:

    • Basics: The full join, or full outer join, merges the data from both tables, ensuring no record is left behind.

    • Real-World Scenario: In a merger scenario, two companies might want to align their customer databases. A full join would highlight customers exclusive to each company and those common to both.

SELECT companyA.customers, companyB.customers 
FROM companyA 
FULL JOIN companyB 
ON companyA.customer_id = companyB.customer_id;

5. Cross SQL Joins: The Combinatorial Powerhouse

For exhaustive combinations:

    • Basics: The cross join, devoid of a join condition, combines each record of one table with every record of another.

    • Real-World Scenario: A fashion brand brainstorming outfit combinations might use a cross join to match every shirt with every pair of pants in their collection.

SELECT shirts.style, pants.style 
FROM shirts 
CROSS JOIN pants;

Optimizing SQL Joins: Perfecting the Art

When dealing with extensive tables or intricate join operations, performance can be a concern. To ensure optimal efficiency, consider the following strategies:

  • Leverage Indexes: Always index the columns that participate in the join. This aids the database engine in swiftly pinpointing relevant rows, enhancing the speed of join processes.
  • Structured Database: Organize your database well to simplify join operations.
  • Filter Before Joining: Use the WHERE clause to reduce the data before joining.
  • Choose Columns Wisely: Only select necessary columns to improve speed.
  • Select the Best Join Type: Match your join type to your data needs.
  • Limit Output: Use conditions or pagination to narrow down results.
  • Regularly Monitor & Optimize: Check the performance of your join queries and make improvements as needed.

SQL joins, while technical, are the gateways to unlocking deep insights in relational databases. Their versatility, ranging from the essential inner join to the exhaustive cross join, offers data analysts a wide palette of tools. By mastering SQL joins, one not only becomes adept at database querying but also gains the ability to weave together complex data narratives.

Share

SQL Date and Time: A Comprehensive Guide

calender, icon, pictogram-2389150.jpg

SQL, or Structured Query Language, is the de facto standard for managing and querying data in relational databases. One of the most common data types that we encounter in databases is the date and time. Understanding how to effectively work with date and time in SQL is essential for data professionals. In this guide, we’ll delve deep into SQL’s date and time functionalities, ensuring you have a clear understanding of how to harness them for your needs.

Table of Contents

  1. Introduction to SQL Date and Time
  2. Date and Time Data Types
  3. SQL Functions for Date and Time
  4. Manipulating Dates and Times
  5. Common Date and Time Queries
  6. Best Practices

1. Introduction to SQL Date and Time

Almost every application or system records some form of temporal information. Whether you’re booking a hotel room, making a purchase online, or tracking user activity, you’ll often find yourself working with dates and times.

In SQL, date and time are not just simple strings or numbers. They are specialized data types designed to store temporal data accurately and allow for efficient querying.

2. Date and Time Data Types

Different database systems might have variations, but the most common date and time data types in SQL include:

    • DATE: Represents a date (year, month, day).

    • TIME: Represents a time of day (hour, minute, second).

    • DATETIME or TIMESTAMP: Represents both date and time.

For example, in MySQL:

CREATE TABLE events (
    id INT AUTO_INCREMENT PRIMARY KEY,
    event_name VARCHAR(255),
    event_date DATE,
    event_time TIME,
    event_datetime DATETIME
);

In this example, a table named events is being created in MySQL with the following columns:

  • id: An integer column that auto-increments. This means that for each new row added, the id value will automatically increase by 1. It’s also defined as the primary key for the table, ensuring uniqueness for each record
  • event_name: A variable character string column (VARCHAR) with a maximum length of 255 characters. It’s used to store the name of the event
  • event_date: A column with the DATE data type to store the date of the event
  • event_time: A column with the TIME data type to store the time at which the event occurs
  • event_datetime: A column with the DATETIME data type to store both the date and time of the event

3. SQL Functions for Date and Time

SQL provides a plethora of functions to extract, manipulate, and compute data based on date and time. Some of the most commonly used functions include:

    • CURRENT_DATE() or NOW(): Returns the current date and time.

    • DAY(), MONTH(), YEAR(): Extracts the day, month, or year from a date.

    • DATEDIFF(): Calculates the difference between two dates.

    • DATE_ADD() or DATE_SUB(): Adds or subtracts a specified time interval from a date.

For instance, to get the current date in SQL Server, you’d use:

SELECT GETDATE();

4. Manipulating Dates and Times

Often, you’ll need to manipulate dates and times for various reasons. Here are some common manipulations:

Adding or Subtracting

SELECT DATE_ADD(CURRENT_DATE(), INTERVAL 7 DAY); 

This adds 7 days to the current date.

  • DATE_ADD() Function: This is a MySQL function used to add a specified time interval to a date.

  • CURRENT_DATE(): This function returns the current date. For instance, if today is September 21, 2023, this function would yield “2023-09-21”.

  • INTERVAL 7 DAY: This indicates the time interval that you want to add. Here, it’s a span of 7 days.

When executed, this SQL expression will return a date that is 7 days after today’s date. So if today is September 21, 2023, the result would be September 28, 2023.

Date Formatting: You might want to format dates in a specific way. Functions like DATE_FORMAT() in MySQL can be of help.

SELECT DATE_FORMAT(CURRENT_DATE(), '%Y-%m-%d');
  • DATE_FORMAT() Function: This MySQL function is used to format a date according to a specified format. You can customize the output format using various format specifiers.

  • CURRENT_DATE(): As before, this function returns the current date.

  • ‘%Y-%m-%d’: This is the format string. Each “%” character followed by a letter (like Y, m, or d) represents a component of the date. Specifically:

    • %Y denotes the four-digit year.
    • %m represents the two-digit month.
    • %d stands for the two-digit day.

Given the format string provided, if the current date is September 21, 2023, the function will return “2023-09-21”.

This might seem redundant since the default format of CURRENT_DATE() is already ‘YYYY-MM-DD’ in MySQL. However, the DATE_FORMAT() function becomes invaluable when you need different or more complex date formats.

5. Common Date and Time Queries

Here are some frequent date and time related queries that you might find useful:

Finding Records from the Last 30 Days:

SELECT * FROM orders WHERE order_date >= DATE_SUB(CURRENT_DATE(), INTERVAL 30 DAY);
Breakdown
  1. FROM orders: The query is targeting the orders table. This is the table from which we want to retrieve data.

  2. **SELECT ***: This clause means that we want to retrieve all columns (represented by the asterisk *) for the rows that meet the condition specified in the WHERE clause.

  3. CURRENT_DATE(): This function returns the current date. So if today’s date is September 21, 2023, this function would return “2023-09-21”.

  4. DATE_SUB(): This function subtracts a specified time interval from a date. In this context, it’s being used to subtract an interval from the current date.

  5. INTERVAL 30 DAY: This indicates the interval that you want to subtract. In this case, it’s 30 days.

  6. WHERE order_date >= DATE_SUB(CURRENT_DATE(), INTERVAL 30 DAY): This is a condition that filters the rows you want to retrieve. It will include only the rows where the order_date is greater than or equal to (i.e., >=) the date that is 30 days before the current date.

What the Query Does:

The query retrieves all records (and all columns for those records) from the orders table where the order_date falls within the last 30 days, including today.

Example:

If today’s date is September 21, 2023, the DATE_SUB(CURRENT_DATE(), INTERVAL 30 DAY) function would return August 22, 2023. Thus, the query will fetch all orders from the orders table with an order_date from August 22, 2023, up to and including September 21, 2023.

In essence, this query is commonly used to extract recent records, in this instance, orders that have been made in the past month.

Grouping Records by Month

SELECT MONTH(order_date) as Month, COUNT(*) as TotalOrders FROM orders GROUP BY MONTH(order_date);

Main Components

  1. FROM orders: This indicates that we’re querying data from the orders table.

  2. **SELECT **: This retrieves all columns for the rows that meet the specified condition. The asterisk () is a wildcard that represents all columns.

  3. CURRENT_DATE(): This is a function that returns the current date.

  4. DATE_SUB(): This is a function that subtracts a specified time interval from a date.

  5. INTERVAL 30 DAY: This specifies the interval to be subtracted, which in this case is 30 days.

  6. WHERE order_date >= DATE_SUB(CURRENT_DATE(), INTERVAL 30 DAY): This condition filters the results to only include rows where the order_date is greater than or equal to the date that is 30 days before the current date.

What the Query Does

The query retrieves all columns from the orders table for orders that have an order_date within the last 30 days, including today.

Example

Let’s say today’s date is September 21, 2023. The function DATE_SUB(CURRENT_DATE(), INTERVAL 30 DAY) would return August 22, 2023.

Thus, the query would fetch all orders from the orders table that have an order_date from August 22, 2023, to September 21, 2023, inclusive.

In essence, this SQL statement is a common way to fetch recent records, in this case, orders from the last month.


6. Best Practices

    • Always Use Date and Time Data Types: Avoid storing dates and times as strings or integers. Using the proper data type ensures accuracy and optimizes performance.

    • Be Mindful of Time Zones: If your application operates across time zones, consider using data types that store timezone information or normalize data to a universal time standard like UTC.

    • Regularly Backup: Time-related data is often critical. Ensure you have regular backups to prevent data loss.

Conclusion

Mastering date and time in SQL is a valuable skill for any data professional. As we’ve seen, SQL offers robust tools and functions to handle temporal data efficiently. With practice and understanding, you can confidently tackle any date or time-related challenge in your database tasks.

Share

Mastering SQL Queries for Beginners: A Comprehensive Guide

circuit board, conductor tracks, circuits-2440249.jpg

Introduction

Welcome to “Mastering SQL Queries for Beginners: A Comprehensive Guide.” SQL, or Structured Query Language, is a powerful tool for managing and manipulating data within relational databases. Whether you’re a database administrator, data analyst, or software developer, this guide is designed to help beginners gain proficiency in SQL queries. We’ll walk you through the essentials with practical examples, ensuring you have a clear understanding from the start.

1. The SELECT Statement

The SQL SELECT statement is the foundation of queries. It allows you to retrieve data from one or more tables based on specific conditions. Let’s start with a simple example:

Query: Retrieve All Columns from the “Employees” Table

SELECT * FROM employees;

2. Filtering Data with the WHERE Clause

To retrieve specific records that meet certain conditions, we use the WHERE clause. Consider this example:

Query: Select Employees from the ‘IT’ Department

SELECT * FROM employees WHERE department = 'IT';

3. Sorting Data with ORDER BY

The ORDER BY clause allows you to arrange query results in ascending or descending order. For instance:

Query: Sort Employees by Last Name in Ascending Order

SELECT * FROM employees ORDER BY last_name ASC;

4. Joining Tables for Data Consolidation

When working with multiple tables, SQL provides various types of joins to combine data from different sources. Let’s illustrate with an example:

Query: Consolidate Order Information

SELECT orders.order_id, customers.customer_name
FROM orders
INNER JOIN customers ON orders.customer_id = customers.customer_id;

5. Aggregating Data with Functions

SQL offers aggregate functions to summarize data. Consider this example:

Query: Calculate Order Statistics

SELECT COUNT(*) AS total_orders, SUM(order_amount) AS total_amount
FROM orders;

6. Filtering Results with HAVING Clause

Similar to WHERE, the HAVING clause filters data based on conditions, but it operates on grouped data. Let’s see an example:

Query: Identify High-Volume Customers

SELECT customer_id, COUNT(*) AS order_count
FROM orders
GROUP BY customer_id
HAVING order_count > 10;

7. Combining Conditions with Logical Operators

SQL supports logical operators (AND, OR, NOT) to combine multiple conditions in a query. Here’s an example:

Query: Select ‘IT’ Department Employees with High Salaries

SELECT *
FROM employees
WHERE department = 'IT' AND salary > 50000;

Conclusion

Mastering SQL queries is fundamental for effective database work. This guide has covered the essentials, including the SELECT statement, filtering data with WHERE, sorting with ORDER BY, joining tables, aggregating data, filtering with HAVING, and combining conditions.

Experiment with Different Scenarios

Create sample databases or use existing ones to practice writing queries. Explore various SQL clauses, functions, and operators to manipulate and retrieve data according to different requirements.

Break Down Complex Queries

When faced with complex queries, break them down into smaller parts. Understand each component individually, test it, and then gradually combine them to create the final query. This approach makes it easier to troubleshoot and understand the logic behind the query.

Utilize Online Resources

Take advantage of online tutorials, forums, and documentation to deepen your understanding of SQL queries. Many websites offer interactive SQL sandboxes where you can practice writing queries and receive immediate feedback.

Analyze Query Performance

As your SQL skills advance, pay attention to the performance of your queries. Understand how indexing, query optimization, and database design can impact query execution time. Optimization techniques can significantly improve the efficiency of your queries.

Stay Updated

SQL is constantly evolving, with new features and improvements being introduced in different database management systems. Stay updated with the latest releases and enhancements in SQL to leverage new functionalities and improve your query-writing capabilities.
With dedication and practice, you can become proficient in SQL queries and unlock the full potential of working with databases. SQL is a powerful language that empowers you to extract insights, analyze data, and make informed decisions based on the information stored in your databases.
So, start exploring SQL queries today and embark on a journey to master this vital skill. The more you practice, the more confident you will become in writing efficient and effective queries, enabling you to harness the true power of your data.

Share

Normal Distribution

All you need to know about Normal Distribution

Imagine a bell-shaped curve that appears over and over in different areas like math science and even in everyday life. This curve is called the normal distribution, or sometimes the Gaussian distribution. It’s a special way to understand how numbers tend to group together. This concept is super important because it helps us make sense of data and predict how things behave in various situations. It is a type of continuous probability distribution for a real-valued random variable and is one of the most important distributions in statistics and the natural sciences.

Characteristics of the Normal Distribution

  1. Symmetry: The normal distribution is symmetric around its mean, with the shape of the distribution identical on either side of the mean.
  2. Mean, Median and Mode: In a perfectly normal distribution, the mean (average), median (middle value) and mode (most frequent value) are all equal and located at the center of the distribution.
  3. Bell-shaped curve: The distribution has a distinct bell shape, which is where the alternative name “bell curve” originates. The bell curve is wide in the middle and tapers off at the ends.
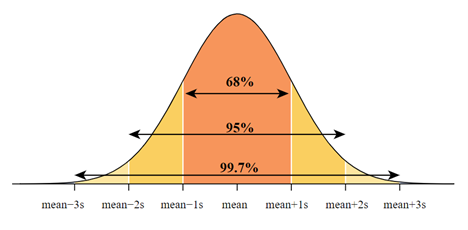
  4. 68–95–99.7 Rule: This rule, also known as the empirical rule, states that for a normal distribution, about 68% of the data falls within one standard deviation of the mean, 95% of the data falls within two standard deviations and approximately 99.7% falls within three standard deviations.

What are the properties of normal distributions?

The normal distribution is a bell-shaped curve that is symmetric around the mean, which is denoted by the symbol μ. This means that if we draw a vertical line through the center of the curve at the mean, the area to the left of the line is equal to the area to the right of the line.

Since the total area under the curve of a normal distribution is equal to 1, this implies that the probability of a randomly chosen value being above the mean is equal to the probability of it being below the mean.

For example, if the mean of a normal distribution is 50 and the standard deviation is 10, then the probability of getting a value between 40 and 50 is the same as the probability of getting a value between 50 and 60

This is because the distribution is symmetric around the mean, and the areas under the curve on either side of the mean are equal.

This property of the normal distribution has many important implications in statistics and data analysis. It allows us to make predictions and calculate probabilities based on the distribution of values around the mean, and it forms the basis for many statistical tests and models.

The standard deviation σ determines the spread or variability of the distribution. As the standard deviation increases, the distribution becomes wider. The normal distribution has many useful properties, such as the fact that 68% of the values fall within one standard deviation of the mean, 95% fall within two standard deviations, and 99.7% fall within three standard deviations.

The standard deviation σ is a measure of the spread or variability of the values in a normal distribution. Specifically, it tells us how much the values in the distribution vary from the mean μ.

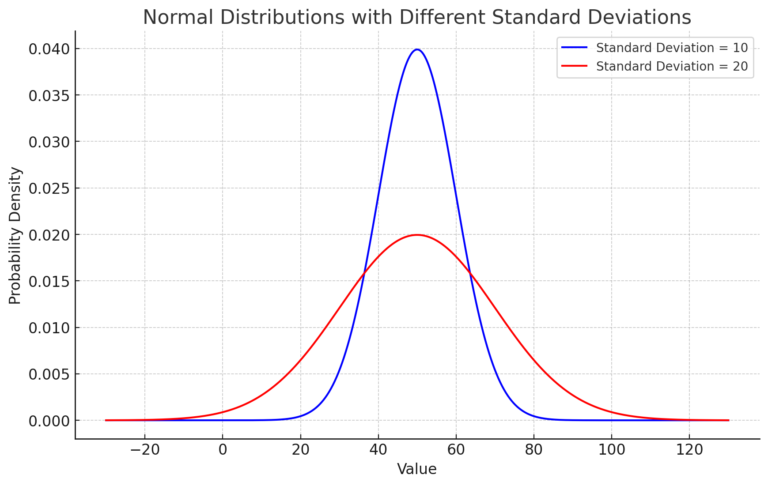
If the standard deviation is small, then the values in the distribution are tightly clustered around the mean, and the distribution is narrow. Conversely, if the standard deviation is large, then the values in the distribution are more spread out and the distribution is wider.


Normal distn curve showing variability

Here’s the graph depicting two normal distributions:

  • The blue curve represents the distribution with a standard deviation of . You can see that its values are mostly concentrated around the mean of , primarily between 40 and 60.

  • The red curve represents the distribution with a standard deviation of . This distribution has a broader spread of values around the mean.

As expected, the distribution with a larger standard deviation is wider, indicating greater variability in the data.

The standard deviation is an important parameter in understanding and analyzing data. It can help us identify outliers or unusual values in a dataset, and it is used in many statistical tests and models to quantify the uncertainty or variability in our measurements or estimates.

The total area under the curve of a normal distribution is equal to 1, which means that the probability of any event occurring is always between 0 and 1

Researchers frequently employ a normal distribution to model the behavior of numerous random variables, such as individuals’ heights or weights within a population.

This characteristic goes by the term “normalization condition.” It guarantees that the overall probability of all potential event outcomes equals 1. In simpler words, the curve’s area represents the cumulative probability of all conceivable outcomes, and this probability consistently ranges between 0 and 1.

In statistical analysis, the normal distribution finds frequent use in estimating the probability of a specific event taking place. By calculating the area under the curve between two points on the distribution, we can determine the probability of an event falling within that range. For example, if we want to know the probability of a person’s height falling between 5’6″ and 6’0″, we can use the normal distribution to calculate this probability.

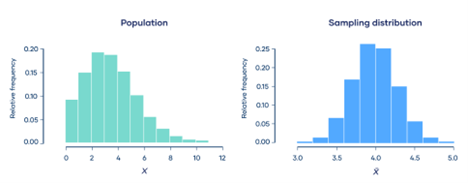
Central limit theorem

It states that the sum or average of a large number of independent and identically distributed random variables tends to follow a normal distribution.

The central limit theorem is a fundamental concept in probability theory and statistics. It states that, under certain conditions, the sum or average of a large number of independent and identically distributed (i.i.d.) random variables tends to follow a normal distribution, even if the individual variables themselves are not normally distributed.

The conditions required for the central limit theorem to hold are:

  1. The random variables must be independent and identically distributed (i.i.d.).
  2. The sample size must be sufficiently large (usually, n ≥ 30).
  3. The random variables must have finite mean and variance.

When these conditions are met, the distribution of the sample mean or sum will be approximately normal, regardless of the underlying distribution of the individual variables. This is particularly useful in practical applications, where the individual variables may have complex and unknown distributions, but the properties of the sample mean or sum can be easily calculated using the normal distribution.

The central limit theorem has important applications in many fields, including finance, physics, engineering and social sciences. It provides a theoretical justification for using statistical inference techniques, such as hypothesis testing and confidence intervals, based on the assumption of normality.

Testing for Normality

Testing for normality is crucial before making assumptions and applying statistical tests. Various techniques can be used to check this, such as QQ-plots, the Shapiro-Wilk test and the Kolmogorov-Smirnov test.

QQ-plot, or quantile-quantile plot, compares two probability distributions by plotting their quantiles against each other. If the data follows a normal distribution, the points in the QQ-plot will approximately lie on the line y = x.

The Shapiro-Wilk test and the Kolmogorov-Smirnov test are statistical methods used to examine whether a dataset adheres to a specific expected pattern. In both tests, the null hypothesis assumes that the data originates from a population with a known distribution. When the computed p-value falls below the predetermined significance level (usually 0.05), this leads to the rejection of the null hypothesis, indicating that the data does not exhibit characteristics of a normal distribution.


When Data Is Not Normally Distributed

There are many scenarios where data may not follow a normal distribution. For instance, economies often exhibit right-skewed income distributions, where many individuals earn a small amount of money, and only a few earn a substantial sum. In such scenarios, practitioners turn to alternatives to standard methods. They employ non-parametric statistical tests that avoid assuming a specific data distribution. Examples include the Wilcoxon signed-rank test for matched pairs of observations and the Mann-Whitney U test for independent observations.

Applications of the Normal Distribution

It is commonly utilized in both natural and social sciences as a means to represent random variables with real values when the exact nature of their distributions is unknown. It serves as a good approximation for a variety of phenomena, including:

  1. Test Scores: Educational systems often assume that student performance follows a pattern similar to the bell-shaped curve. This simplifies grouping students into categories like “above average,” “average,” or “below average.”
  2. Measurements: Physical attributes such as height, weight, or blood pressure within a group of individuals tend to exhibit a similar bell-shaped pattern.
  3. Quality Control: Numerous manufacturing and business processes adopt this curve to assess variations and ensure quality standards.
  4. Stock Market Returns: In the realm of finance, the returns on stocks or portfolios frequently exhibit a propensity towards a bell-shaped curve pattern.

The normal distribution is not just a cornerstone of statistics; it is a fundamental tool that permeates many scientific disciplines and everyday applications. Its universal nature allows us to make sense of patterns and behaviors in diverse fields, from education and healthcare to manufacturing and finance. 

Understanding its characteristics, uses, and importance can greatly enhance our understanding of the world. As we continue to gather and analyze data, the normal distribution will undoubtedly remain a valuable tool, guiding us to the path of new discoveries and insights.

Share

Data Collection in Data Science

In the world of data science, data collection is a critical process that forms the foundation of any successful analysis or model development. By systematically gathering relevant information, data scientists gain valuable insights that drive informed decision-making. However, to optimize the benefits of data collection, it is essential to consider factors such as the importance of timeframe for data collection and the appropriate storage solutions. In this article, we will explore why data collection is crucial, the significance of timeframe selection, and the tools and platforms available for effective data collection and storage.

1. Importance of Data Collection in Data Science

Insight Generation

Every dataset is not just a mere collection of numbers or text; it’s a repository of stories, waiting to be discovered. When organizations invest time and resources in scrupulous data collection methods, they position themselves to uncover a myriad of these hidden narratives. These narratives, in the form of patterns, trends and correlations, offer actionable insights. For instance, an e-commerce company might identify that most of its customers prefer shopping late at night, leading to strategic decisions like introducing midnight sales or offers. Thus, the emphasis on insight generation is not just about gathering data but intelligently leveraging it for optimized decision-making.


Problem Identification and Resolution

Consider a well-curated dataset as a magnifying glass, highlighting the intricacies and issues inherent within a system. Through diligent collection and subsequent deep analysis, data professionals get equipped to pinpoint specific challenges, be it in product performance, service delivery or operational bottlenecks. Understanding the root of these problems is half the battle. The next step, devising strategic solutions, becomes much more straightforward once the problem is clear. For instance, in healthcare, analyzing patient data might reveal recurrent infections from a specific source, leading to targeted interventions. Similarly, in finance, analyzing transaction data can uncover fraud patterns. In essence, data not only identifies the problem but also guides towards its resolution.

Model Development

The rapidly advancing fields of machine learning (ML) and artificial intelligence (AI) heavily rely on data. But it’s not just any data; the quality, diversity, and representativeness of this data are paramount. When data scientists have access to comprehensive datasets, the predictive models they build stand a higher chance of being precise. Think of a weather prediction model; the more historical and diverse data it has (spanning various seasons, geographies, and anomalies), the better its future forecasts. In industries like , predictive models can determine consumer buying behavior and in healthcare, they can predict disease outbreaks. The potential is vast, but it all hinges on the quality of collected data.


Business Expansion

For any business, understanding its customer base is crucial. Here, data steps in as a reflective tool, offering a clear image of customer preferences, behaviors and needs. By analyzing purchase histories, product reviews and customer feedback, businesses gain a deeper understanding of what their audience values. Armed with this knowledge, organizations can tailor their products or services to better cater to their audience’s desires. For instance, a software company, upon analyzing user feedback, might introduce new features in its next update. Furthermore, enhancing customer experiences based on data insights can lead to increased brand loyalty, repeat purchases and overall business growth. In essence, data-driven insights pave the way for businesses to evolve and expand in alignment with customer needs.


matrix, face, silhouette-69681.jpg

2. The Imperative of Timeframe Selection in Data Collection

Timeframes play a pivotal role in data collection, shaping the insights we derive and the subsequent actions we take based on these insights. By understanding the significance of historical, real-time and seasonal data, organizations can make more informed decisions that drive success in their respective fields.

Historical Data Analysis

Every current trend or pattern often has its roots embedded in history. Analyzing historical data provides a window to look back and trace the origin of these patterns. It adds depth to our understanding of the present scenario, helping decision-makers contextualize current phenomena in light of past events. An in-depth grasp of the past enhances the accuracy of forecasting. Analysts can compare performance metrics over different periods, providing a trajectory of growth or decline. This retrospective analysis offers insights into what strategies worked, which ones didn’t and why.
 

Real-Time Data Assimilation

In an increasingly digital landscape, real-time data acts as an immediate feedback mechanism, especially vital for industries like finance and e-commerce that operate in fluctuating environments. This instantaneous data not only allows businesses to gauge the current market sentiments but also empowers them with agile decision-making capabilities. Whether responding to a sudden shift in e-commerce product demand or adjusting strategies on the fly, real-time insights provide businesses a significant competitive advantage. By capitalizing on these insights, organizations can proactively cater to customer needs, seize transient market opportunities, and promptly counteract potential challenges.
 

Accounting for Seasonality

Industries such as retail and agriculture are deeply influenced by pronounced seasonal patterns. Recognizing these rhythms, like discerning planting or harvest seasons, is paramount for strategic planning. By adopting a holistic approach to data collection across varied timeframes, businesses ensure they grasp the entirety of these . This all-encompassing understanding, in turn, equips organizations with enhanced forecasting abilities, enabling them to preempt demand variations, streamline inventory management and craft marketing initiatives in harmony with the industry’s cyclical tendencies.


clones, computer, cube-2029896.jpg

3. Data Storage: Preserving the Lifeline

The acquisition of data is just one half of the equation. Once acquired, this voluminous data must be securely housed, meticulously organized and made readily accessible for future retrieval and analysis. The evolution of data storage solutions over the years has provided organizations with multiple options, each catering to specific requirements and use cases.

1. Relational Databases: The Structured Sanctuary

Relational databases, like MySQL, PostgreSQL and Oracle, are designed to cater to structured data, often presenting it in the familiar form of tables. Here are some of the noteworthy features:

  • Robust Querying: These systems come equipped with powerful querying capabilities, allowing users to extract, modify or delete data with efficiency.

  • Indexing and Transaction Support: By creating indexes, relational databases optimize data retrieval speeds. Additionally, they ensure data integrity with transaction support, making sure that all operations (like inserts, updates, or deletes) are completed successfully or none are executed at all.


2. NoSQL Databases: Navigating the Uncharted Waters

When dealing with unstructured or semi-structured data, NoSQL databases such as MongoDB or Cassandra stand out. Their unique architecture offers several benefits:

  • Flexibility: Unlike their structured counterparts, NoSQL databases don’t mandate a fixed schema. This gives organizations the flexibility to evolve their data models over time without significant restructuring.

  • Scalability and Speed: These databases are built for scale, allowing horizontal scaling which is particularly useful for applications with large amounts of rapidly growing data.


3. Cloud Storage Solutions: Sky-high Potential

Cloud storage platforms, including Amazon S3, Google Cloud Storage and Microsoft Azure Storage, have transformed the way data is stored and accessed. Their key offerings include:

  • Scalability and Redundancy: The cloud offers virtually limitless storage, scaling as per demand. Additionally, these platforms create redundant copies of data, ensuring high availability and durability.

  • Seamless Integrations: Being in the cloud ecosystem, these storage solutions seamlessly integrate with other cloud services, ensuring smooth workflows and data interchange.


4. Data Lakes: The Raw Reservoirs

Platforms such as Apache Hadoop or AWS Glue function as data lakes. Their uniqueness lies in their approach to data:

  • Diverse Data Consolidation: These platforms can house diverse data types, be it structured or unstructured, all under one roof.

  • Unaltered Storage: Data lakes store information in its raw, unprocessed state. This allows organizations the flexibility of exploratory analysis, diving deep into data without the constraints of pre-defined structures.


Conclusion

In data science, data collection is not just a process, but a foundational element. Its importance reverberates across every stage, from initial data acquisition to advanced analysis. The careful selection of data collection timeframes ensures relevancy, while modern storage solutions guarantee data’s integrity and accessibility. As data continues to be the modern age’s gold, understanding and mastering its collection and storage become imperative for any forward-thinking organization.

Share

Zoom Privacy Update

The Zoom Dilema: AI and Ethics in Digital World

video conference, webinar, skype-5363856.jpg

In today’s digital age, we have increasingly come to rely on platforms such as Zoom to connect, collaborate and communicate. Artificial Intelligence (AI) advancements promise efficiency, prediction and personalization. Yet, when these two worlds collide, as they recently did with Zoom’s policy update, a cascade of ethics and dilemma emerges.

One might feel compelled to dissect and reflect upon these developments, understanding their implications and hoping to stimulate a broader discourse about our collective digital future.

The Backdrop: Zoom’s Controversial Policy Change

Aramco announces deal with Zoom at LEAP 2023 


In March, as reported by Indian Express, Zoom made a subtle change to its user agreement, granting itself the permission to utilize user data to enhance its AI capabilities. 


This decision ignited significant backlash and widespread concerns across multiple sectors. In response to the intense criticism, Zoom’s CEO, Eric Yuan, clarified that the new policy’s phrasing was due to an oversight in their process. He emphasized that there wasn’t any malicious intent behind the change.

Zoom quickly explained their new terms, saying they just want to use AI to make calls better and less tiring for users. But, adding AI like this has many ethical questions.

In an era dominated by virtual communication, companies are constantly striving to innovate and enhance user experiences. While the intentions might have been to streamline and improve virtual interactions, the discreet nature of this update revealed deeper questions about ethics that every tech giant must grapple with in the age of AI integration.


Why is this worth discussing?

  • Transparent Communication is Paramount: At the heart of every successful service lies trust- trust that is cultivated through transparent and consistent communication. When there’s a shift in policies, particularly those that can impact user data and privacy, it is vital for organizations to be upfront about it. By making changes discreetly, companies inadvertently breach the trust users place in them. Zoom’s quiet alteration of its terms, regardless of its intent, highlights the need for clear communication. It’s not just about what changes are made but also how they are conveyed.
  • Guarding Intellectual Property and Privacy: With the rise of AI’s capabilities, there’s a growing concern about the distinction between original human content and content generated by machines. What if an AI model replicates a business strategy discussed in a private meeting or a unique idea shared in a brainstorming session? Beyond replication, there’s an undeniable anxiety about the sanctity of private discussions. Are our conversations merely data points for AI training?
  • Striking a Balance – Assistance vs. Surveillance: There’s a thin line between AI tools designed to enhance user experience and those that monitor and profile user behaviors. The ethical dilemma arises when the latter becomes prevalent. For instance, does an AI that tracks participation in a meeting to improve engagement cross the boundary and become an unwanted observer?
  • Data Repositories: A Double-edged Sword: Storing vast amounts of data certainly aids in refining AI models. However, these data goldmines are also prime targets for cyberattacks. Beyond the threat of external breaches, there’s the looming concern of how companies themselves might use the data. Can users be assured that their data remains confined to its intended purpose and not be inadvertently used elsewhere or sold?
  • Ensuring Equity in AI Systems: AI, being a reflection of the data it’s trained on, can sometimes echo and perpetuate societal biases. In platforms like Zoom, this bias could manifest subtly, maybe by prioritizing certain voices or misreading cultural idiosyncrasies. The question is: How do tech giants ensure their AI tools are fair and unbiased?

“If we’re not thoughtful and careful, we’re going to end up with redlining again.”
— Karen Mills, senior fellow at the Business School and head of the U.S. Small Business Administration from 2009 to 2013

“I wouldn’t have a central AI group that has a division that does cars, I would have the car people have a division of people who are really good at AI.”
— Jason Furman, a professor of the practice of economic policy at the Kennedy School and a former top economic adviser to President Barack Obama

Reflections on Our Digital Path

The recent situation with Zoom brings to light many thoughts about our growing digital world. It’s clear that the power and convenience of AI are hard to resist. It offers us faster ways to work, new ways to communicate, and sometimes, even insights we might not have seen ourselves. But with these advantages come important questions.

What happened with Zoom is just one example of many challenges we’re going to face. As AI becomes more a part of our lives, we need to ask: Are we creating a world that serves and understands us? Or are we maybe setting the stage for a world where technology has a little too much say?

In thinking about all this, it’s clear we’re at an important moment. We’re deciding the shape of our digital future. It’s not about avoiding the good things AI brings. It’s about making sure we use them in a way that keeps our human values strong.


Share
Scroll to Top